Radius Report for
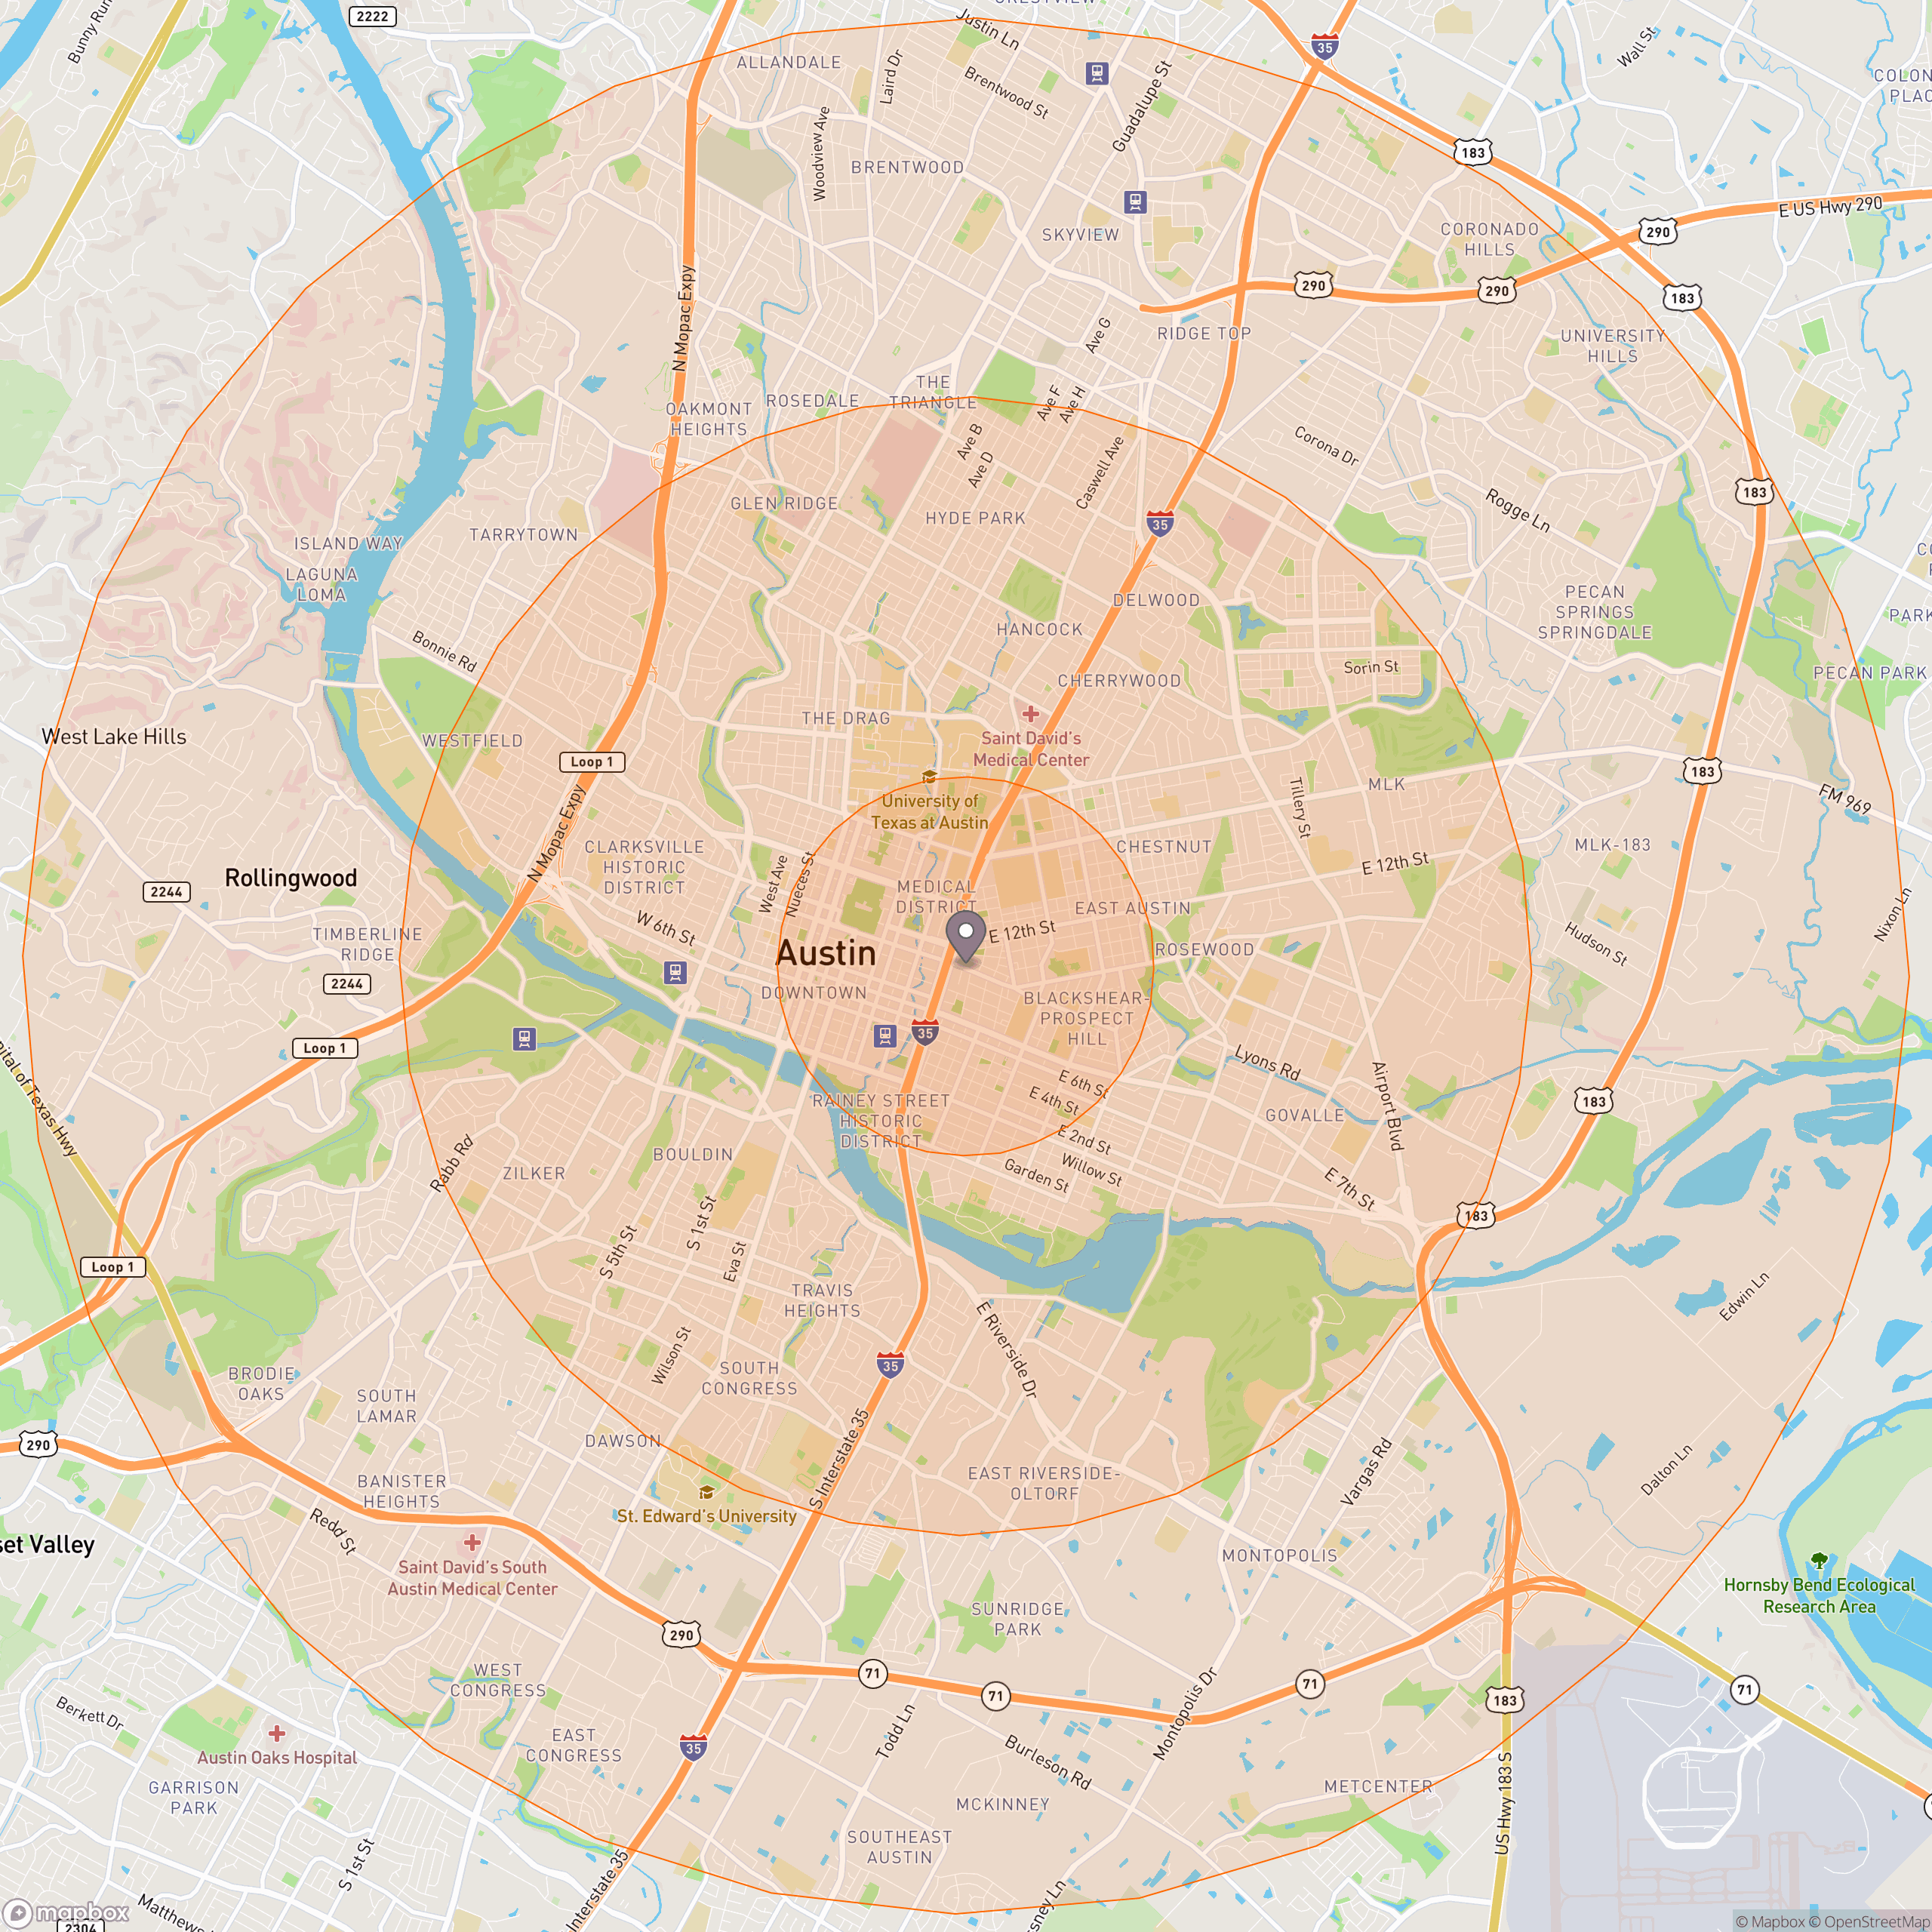
1, 3, and 5 miles around
900 E 11th St, Austin, TX 78702
Prepared for: Best Texas Bbq
Date: February 18, 2026
Map
Prepared for: Best Texas Bbq
Date: February 18, 2026
City Austin
County Travis County
City: 980K County: 1,330K
City: $94K County: $100K
median household incomeCity: 35 County: 36
median age in years
| 1 mile | 3 miles | 5 miles | |||
|---|---|---|---|---|---|
| Population | 19,477 | 176,920 | 339,148 | ||
| Population Density (people per sq mi) | 6,270 | 6,467 | 4,426 |
Source: U.S. Census Bureau, 2024 American Community Survey, Tables B01003
| 1 mile | 3 miles | 5 miles | ||||||
|---|---|---|---|---|---|---|---|---|
| Median Household Income (in 2024 inflation adjusted dollars) | $120,581 | $94,266 | $91,770 | |||||
| Average Household Income (in 2024 inflation adjusted dollars) | $155,176 | $146,785 | $143,226 | |||||
| Families in Poverty | 185 | 8% | 2,905 | 10% | 6,204 | 10% | ||
| Households | 10,449 | 89,091 | 166,074 | |||||
| Less than $25,000 | 1,443 | 14% | 14,806 | 17% | 24,887 | 15% | ||
| $25,000 to $49,999 | 1,011 | 10% | 12,629 | 14% | 23,962 | 14% | ||
| $50,000 to $74,999 | 1,174 | 11% | 11,258 | 13% | 23,351 | 14% | ||
| $75,000 to $99,999 | 584 | 6% | 7,594 | 9% | 16,153 | 10% | ||
| $100,000 to $199,999 | 3,351 | 32% | 23,261 | 26% | 43,983 | 26% | ||
| Over $200,000 | 2,886 | 28% | 19,544 | 22% | 33,737 | 20% | ||
Source: U.S. Census Bureau, 2024 American Community Survey, Tables B19001, B19013, B19025, B17010
| 1 mile | 3 miles | 5 miles | ||||||
|---|---|---|---|---|---|---|---|---|
| Median Age | 34 | 32 | 33 | |||||
| Population | 19,477 | 176,920 | 339,148 | |||||
| Ages 9 & under | 549 | 3% | 11,662 | 7% | 27,647 | 8% | ||
| Ages 10 to 19 | 2,561 | 13% | 21,881 | 12% | 38,230 | 11% | ||
| Ages 20 to 29 | 4,647 | 24% | 47,249 | 27% | 79,157 | 23% | ||
| Ages 30 to 39 | 4,783 | 25% | 38,974 | 22% | 72,656 | 21% | ||
| Ages 40 to 49 | 2,227 | 11% | 21,700 | 12% | 44,870 | 13% | ||
| Ages 50 to 59 | 1,987 | 10% | 14,958 | 8% | 32,687 | 10% | ||
| Ages 60 to 69 | 1,661 | 9% | 11,109 | 6% | 22,438 | 7% | ||
| Ages 70 & over | 1,063 | 5% | 9,386 | 5% | 21,463 | 6% | ||
Source: U.S. Census Bureau, 2024 American Community Survey, Tables B01001
| 1 mile | 3 miles | 5 miles | ||||||
|---|---|---|---|---|---|---|---|---|
| Population | 19,477 | 176,920 | 339,148 | |||||
| White | 10,880 | 56% | 95,113 | 54% | 175,760 | 52% | ||
| Black | 1,744 | 9% | 10,035 | 6% | 21,617 | 6% | ||
| American Indian | 22 | 0% | 218 | 0% | 359 | 0% | ||
| Asian | 1,343 | 7% | 14,417 | 8% | 22,152 | 7% | ||
| Pacific Islander | 5 | 0% | 30 | 0% | 60 | 0% | ||
| Other race | 247 | 1% | 751 | 0% | 1,400 | 0% | ||
| Two or more races | 676 | 3% | 8,637 | 5% | 15,730 | 5% | ||
| Hispanic or Latino | 4,560 | 23% | 47,719 | 27% | 102,073 | 30% | ||
Source: U.S. Census Bureau, 2024 American Community Survey, Tables B03002
| 1 mile | 3 miles | 5 miles | ||||||
|---|---|---|---|---|---|---|---|---|
| Population Aged 25 & Over | 14,621 | 119,913 | 238,507 | |||||
| No high school diploma | 898 | 6% | 7,436 | 6% | 18,133 | 8% | ||
| High school graduate or equal | 922 | 6% | 10,626 | 9% | 27,486 | 12% | ||
| Some college | 1,612 | 11% | 12,370 | 10% | 28,344 | 12% | ||
| Associate's degree | 434 | 3% | 4,478 | 4% | 9,410 | 4% | ||
| Bachelor's degree | 6,275 | 43% | 51,212 | 43% | 94,107 | 39% | ||
| Advanced degree | 4,481 | 31% | 33,791 | 28% | 61,027 | 26% | ||
Source: U.S. Census Bureau, 2024 American Community Survey, Tables B15002
| 1 mile | 3 miles | 5 miles | ||||||
|---|---|---|---|---|---|---|---|---|
| Population Aged 16 & Over | 18,455 | 159,452 | 296,641 | |||||
| In labor force | 13,641 | 74% | 118,514 | 74% | 222,333 | 75% | ||
| Civilian labor force | 13,615 | 74% | 118,426 | 74% | 222,131 | 75% | ||
| Employed | 13,111 | 71% | 112,764 | 71% | 211,169 | 71% | ||
| Unemployed | 505 | 3% | 5,662 | 4% | 10,961 | 4% | ||
| In armed forces | 25 | 0% | 88 | 0% | 202 | 0% | ||
| Not in labor force | 4,814 | 26% | 40,938 | 26% | 74,309 | 25% | ||
Source: U.S. Census Bureau, 2024 American Community Survey, Tables B23025
| 1 mile | 3 miles | 5 miles | ||||||
|---|---|---|---|---|---|---|---|---|
| Households | 10,449 | 89,091 | 166,074 | |||||
| Family households | 2,406 | 23% | 27,973 | 31% | 61,840 | 37% | ||
| Married couples | 1,938 | 19% | 20,756 | 23% | 44,500 | 27% | ||
| With kids under 18 | 316 | 3% | 7,225 | 8% | 17,120 | 10% | ||
| Other family types | 468 | 4% | 7,217 | 8% | 17,340 | 10% | ||
| Single dad households with kids | 4 | 0% | 735 | 1% | 1,925 | 1% | ||
| Single mom households with kids | 289 | 3% | 2,592 | 3% | 6,040 | 4% | ||
| Non-family households | 8,043 | 77% | 61,118 | 69% | 104,234 | 63% | ||
Source: U.S. Census Bureau, 2024 American Community Survey, Tables B11001, B11003
| 1 mile | 3 miles | 5 miles | ||||||
|---|---|---|---|---|---|---|---|---|
| Homes | 11,664 | 96,846 | 178,608 | |||||
| Occupied Homes | 10,449 | 89,091 | 166,074 | |||||
| Owner occupied units | 3,673 | 35% | 29,738 | 33% | 59,881 | 36% | ||
| Renter occupied units | 6,776 | 65% | 59,353 | 67% | 106,193 | 64% | ||
Source: U.S. Census Bureau, 2024 American Community Survey, Tables B25024, B25003
| 1 mile | 3 miles | 5 miles | ||||||
|---|---|---|---|---|---|---|---|---|
| Median Home Value | $628,516 | $806,349 | $711,243 | |||||
| Owner Occupied Homes | 3,673 | 29,738 | 59,881 | |||||
| Under $100,000 | 27 | 1% | 527 | 2% | 1,510 | 3% | ||
| $100,000 to $199,999 | 115 | 3% | 488 | 2% | 1,258 | 2% | ||
| $200,000 to $299,999 | 159 | 4% | 1,350 | 5% | 2,997 | 5% | ||
| $300,000 to $399,999 | 187 | 5% | 1,892 | 6% | 4,986 | 8% | ||
| $400,000 to $499,999 | 785 | 21% | 2,828 | 10% | 6,768 | 11% | ||
| $500,000 to $749,999 | 1,096 | 30% | 6,513 | 22% | 14,701 | 25% | ||
| $750,000 to $999,999 | 686 | 19% | 5,638 | 19% | 9,832 | 16% | ||
| $1,000,000 to $1,499,999 | 300 | 8% | 5,199 | 17% | 8,607 | 14% | ||
| $1,500,000 to $1,999,999 | 51 | 1% | 2,004 | 7% | 3,251 | 5% | ||
| Over $2,000,000 | 267 | 7% | 3,299 | 11% | 5,971 | 10% | ||
Source: U.S. Census Bureau, 2024 American Community Survey, Tables B25075
| 1 mile | 3 miles | 5 miles | ||||||
|---|---|---|---|---|---|---|---|---|
| Population | 19,477 | 176,920 | 339,148 | |||||
| Male: | 10,074 | 52% | 90,479 | 51% | 174,510 | 51% | ||
| Under 5 years | 173 | 1% | 3,510 | 2% | 7,009 | 2% | ||
| 5 to 9 years | 132 | 1% | 2,394 | 1% | 6,633 | 2% | ||
| 10 to 14 years | 141 | 1% | 2,521 | 1% | 6,726 | 2% | ||
| 15 to 17 years | 169 | 1% | 1,617 | 1% | 4,361 | 1% | ||
| 18 and 19 years | 690 | 4% | 5,613 | 3% | 7,910 | 2% | ||
| 20 years | 188 | 1% | 2,540 | 1% | 2,973 | 1% | ||
| 21 years | 113 | 1% | 2,741 | 2% | 3,793 | 1% | ||
| 22 to 24 years | 534 | 3% | 6,351 | 4% | 10,226 | 3% | ||
| 25 to 29 years | 1,455 | 7% | 11,892 | 7% | 22,381 | 7% | ||
| 30 to 34 years | 1,320 | 7% | 12,223 | 7% | 21,351 | 6% | ||
| 35 to 39 years | 1,405 | 7% | 9,078 | 5% | 17,882 | 5% | ||
| 40 to 44 years | 579 | 3% | 6,656 | 4% | 13,548 | 4% | ||
| 45 to 49 years | 461 | 2% | 4,894 | 3% | 10,638 | 3% | ||
| 50 to 54 years | 759 | 4% | 4,640 | 3% | 9,427 | 3% | ||
| 55 to 59 years | 395 | 2% | 3,396 | 2% | 8,589 | 3% | ||
| 60 and 61 years | 192 | 1% | 1,631 | 1% | 2,956 | 1% | ||
| 62 to 64 years | 286 | 1% | 1,818 | 1% | 3,530 | 1% | ||
| 65 and 66 years | 218 | 1% | 830 | 0% | 1,879 | 1% | ||
| 67 to 69 years | 292 | 1% | 1,575 | 1% | 2,953 | 1% | ||
| 70 to 74 years | 364 | 2% | 2,216 | 1% | 4,682 | 1% | ||
| 75 to 79 years | 130 | 1% | 1,377 | 1% | 2,653 | 1% | ||
| 80 to 84 years | 45 | 0% | 557 | 0% | 1,260 | 0% | ||
| 85 years and over | 34 | 0% | 409 | 0% | 1,151 | 0% | ||
| Female: | 9,403 | 48% | 86,441 | 49% | 164,638 | 49% | ||
| Under 5 years | 90 | 0% | 3,211 | 2% | 7,523 | 2% | ||
| 5 to 9 years | 154 | 1% | 2,547 | 1% | 6,482 | 2% | ||
| 10 to 14 years | 268 | 1% | 2,269 | 1% | 5,287 | 2% | ||
| 15 to 17 years | 130 | 1% | 1,917 | 1% | 4,588 | 1% | ||
| 18 and 19 years | 1,163 | 6% | 7,944 | 4% | 9,358 | 3% | ||
| 20 years | 228 | 1% | 2,640 | 1% | 3,222 | 1% | ||
| 21 years | 137 | 1% | 2,404 | 1% | 3,361 | 1% | ||
| 22 to 24 years | 547 | 3% | 6,789 | 4% | 11,189 | 3% | ||
| 25 to 29 years | 1,446 | 7% | 11,893 | 7% | 22,012 | 6% | ||
| 30 to 34 years | 1,090 | 6% | 10,321 | 6% | 19,155 | 6% | ||
| 35 to 39 years | 968 | 5% | 7,351 | 4% | 14,267 | 4% | ||
| 40 to 44 years | 546 | 3% | 5,585 | 3% | 11,197 | 3% | ||
| 45 to 49 years | 642 | 3% | 4,565 | 3% | 9,488 | 3% | ||
| 50 to 54 years | 541 | 3% | 3,993 | 2% | 7,930 | 2% | ||
| 55 to 59 years | 292 | 1% | 2,929 | 2% | 6,741 | 2% | ||
| 60 and 61 years | 106 | 1% | 1,090 | 1% | 2,482 | 1% | ||
| 62 to 64 years | 245 | 1% | 1,659 | 1% | 3,586 | 1% | ||
| 65 and 66 years | 181 | 1% | 812 | 0% | 1,603 | 0% | ||
| 67 to 69 years | 141 | 1% | 1,693 | 1% | 3,448 | 1% | ||
| 70 to 74 years | 302 | 2% | 2,102 | 1% | 4,882 | 1% | ||
| 75 to 79 years | 52 | 0% | 1,160 | 1% | 2,871 | 1% | ||
| 80 to 84 years | 45 | 0% | 773 | 0% | 1,722 | 1% | ||
| 85 years and over | 92 | 0% | 792 | 0% | 2,243 | 1% | ||
Source: U.S. Census Bureau, 2024 American Community Survey, Tables B01001, B01003. The numbers in the above table may not total up due to rounding.
State and county population projections.
| Geography | 2010 - 2020 | 2020 - 2030 Projected | Is Projected To: |
|---|---|---|---|
| Texas |
16%25,145,561 - 29,145,505 |
13%29,145,505 - 32,912,882 |
Grow |
| Travis County |
26%1,024,266 - 1,290,188 |
22%1,290,188 - 1,572,639 |
Grow |
Source: Texas Demographic Center at The University of Texas at San Antonio. Projections of the Total Population of Texas and Counties in Texas, 2020-2060, October 2022.
U.S. Census Bureau, Decennial Censuses 2010, and 2020.
| Radius | 2019 - 2024 | 2025 - 2030 Projected | Your Radius is Projected To: |
|---|---|---|---|
| 1 mile |
2%19,058 - 19,477 |
7%25,605 - 27,294 |
Grow |
| 3 miles |
3%171,887 - 176,920 |
-1%193,503 - 192,153 |
Decline |
| 5 miles |
0%338,120 - 339,148 |
-1%364,998 - 361,362 |
Decline |
Source: US Census Bureau. 2019 American Community Survey 5-Year Estimates. B01003 TOTAL POPULATION. US Census Bureau. 2024 American Community Survey 5-Year Estimates. B01003 TOTAL POPULATION. Applied Geographic Solutions. Estimates and Projections. 2025B.
First, we subtract the 2024 US Census Bureau's water areas from the 2024 block groups. Then we calculate the project's radiuses, the block groups minus water areas that intersect the radiuses, and the percent of each block group's area that's in the radiuses (overlap). Next, the overlap percent is multiplied by the Census demographics for each block group. Finally, we sum the overlap times the demographics for all block groups that intersect a radius to produce the demographic estimate for the radius.
The benefits of this methodology are that it allows for:
This methodology assumes that the population is equally distributed throughout a block group. This assumption can result in unlikely estimates for small radiuses (i.e. 1 mile) in rural areas with low population densities and thus, large geographic area block groups.
To estimate median values, we use a simple method explained in the book "Beginning Statistics: An Introduction for Social Scientists" by Diamond I and Jefferies J. Here's how it works:
If you have any questions, you can reach Cubit at 1.800.939.2130 or at www.cubitplanning.com.
![]()
Prepared by Cubit
6800 West Gate Blvd. Ste. 132-366
Austin, TX 78745-4648
www.cubitplanning.com
1.800.939.2130