Your Options For Demographics Reports: A Comprehensive Guide
by Cubit Team | 2024 July 9
Introduction
Knowing the demographics of an area can be the deciding factor between opening your next most profitable location and facing the unfortunate closure of your business. One powerful tool to help you make data driven decisions is a demographics report.
Demographics reports provide valuable insights into the characteristics of a population within a specific area, helping you understand your potential customers and choose optimal locations for your business. Since 2009, we’ve helped more than 14,131 businesses get demographic reports. We wrote this guide to explore different demographics reports, explaining their benefits and how you can use them effectively.
What is a Demographics Report?
A demographics report is exactly what it sounds like: a report with detailed information about the characteristics of a specific population. Key components typically include age, gender, income, education, and more depending on your organization.
Small business owners typically start their demographic analysis by examining data for large geographies (like zips, cities or counties) first – and I’ll tell you how to do this for free below – before selecting individual sites of interest by working with a realtor or a real estate platform like LoopNet. Once you have addresses of interest, you’ll want to get either a radius report or a drive time reports, which focus on custom geographic areas relevant to your business operations.
Use Cases of Demographics Reports for Business Owners
Site Selection.
A demographics report helps you understand the population around potential sites, allowing you to select a location where your target market lives or works.
Target Marketing.
Understanding who your customers are and where they live enables you to tailor your marketing efforts effectively.
Market Analysis.
This involves examining the demographics, consumer behavior, and economic conditions in the area surrounding your existing locations to optimize operations and marketing strategies.
3 Types of Demographics Reports
Demographic Report 1: Free Narrative Profiles for Large Geographies
Let’s assume you already have single large geography that you want to get demographics for, one of the most accessible and reliable sources for demographic data is the US Census Bureau's website. The Bureau offers a wealth of information, including Narrative Profiles for cities, ZIP codes, and counties, all available for free. These profiles provide a comprehensive overview of various demographic attributes such as population size, age distribution, income levels, education attainment, and more.
How to Access Census Demographics from the US Census Bureau's Narrative Profiles
Step 1: Go to the Narrative Profiles Tool
- Open your web browser and go here.
- This will take you to the most current year available for the Narrative Profiles.
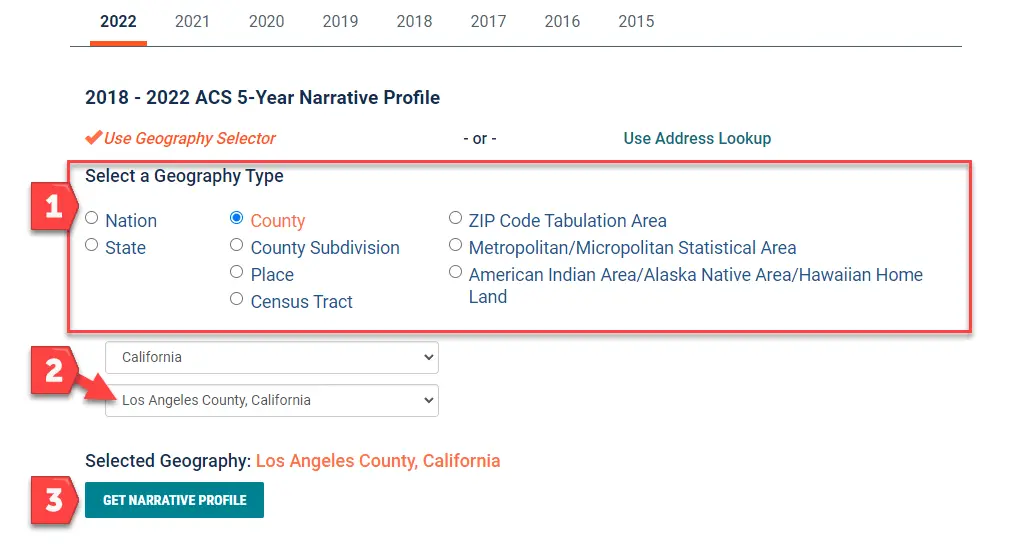
Step 2: Select Your Geography
- You will be prompted to select the type of geography you are interested in (e.g. state, county, city, zips).
- After selecting the type of geography, a dropdown list will appear. Use this list to choose the specific name of the area you are interested in. For example, if you selected “County” in the previous step, you will get a dropdown box that will show all of the states, and then a second list will show all of the counties in the state you selected.
-
Click the “Get Narrative Profile” button.
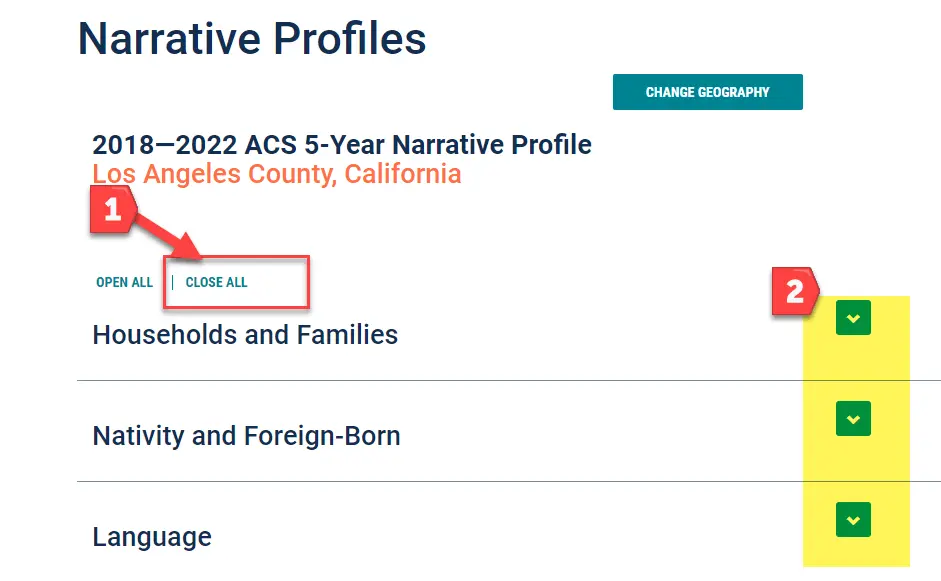
Step 3: Review the Data
- You will now be directed to the Narrative Profile for your selected geography. This page is divided into various data categories, providing comprehensive insights about the area. To efficiently navigate through the data, find the “CLOSE ALL” link just below your geography’s name. Clicking this will collapse all the categories, allowing you to view the headings quickly.
-
You can then click on the down arrow buttons next to each category to expand and view the specific demographics in this report that you are interested in.
-
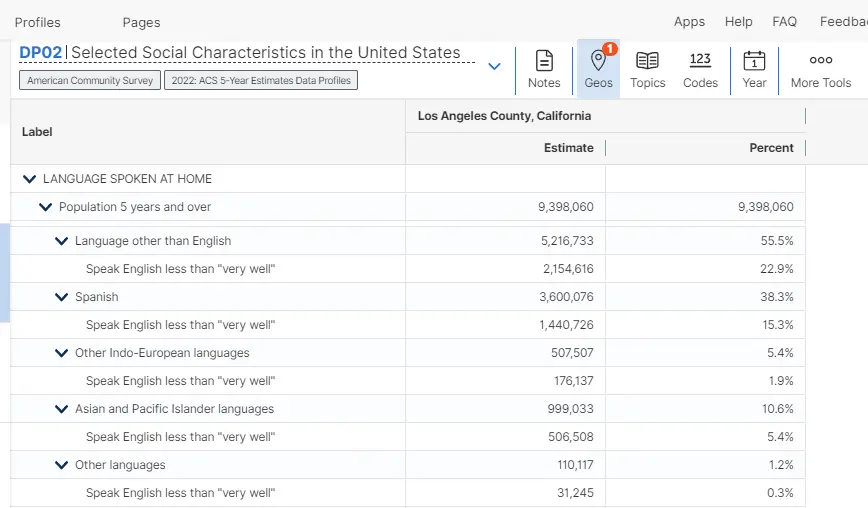
When viewing the demographic report, each bar graph will also have an option to view the data in table format.
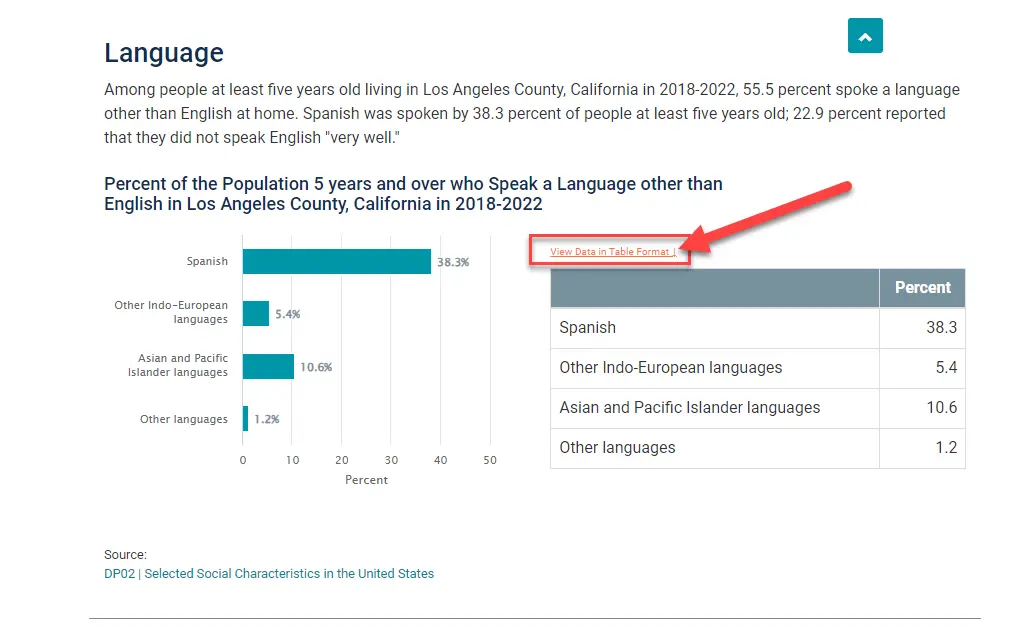
-
Additionally, beneath each table, there is a “Source” link that you may click to view the full Census table from which the data is sourced.
By following these steps, you’ll get a basic demographic report to begin to familiarize yourself with who lives in your area of interest. Hopefully, you’ll find that your target market lives in your county, city or zip code of interest. If this is the case, many business owners work with local realtors, check LoopNet or start driving around to find specific properties that may be good fits for their new business.
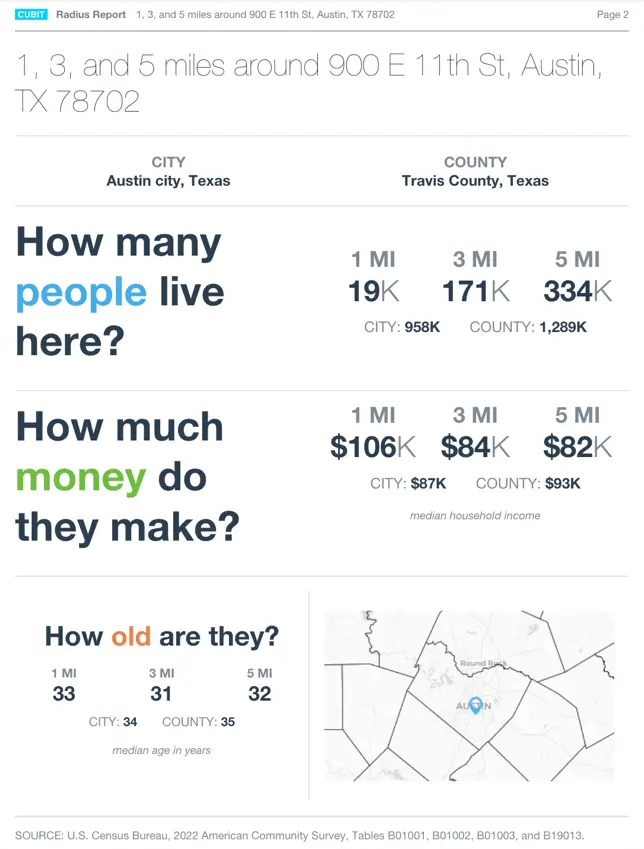
Demographic Report 2: A Radius Report with Data for Rings Around an Address
Once you have an address or (addresses) for a potential site(s), the next demographic report you may need is a radius report. Radius reports focus on demographic data within a specified distance from a central point, such as your new business location.
Unlike Narrative Profiles, which provide data for predefined areas like cities or zips codes, radius reports allow you to define the exact area you want to analyze. Your address is unlikely to be exactly in the center of a city or zip code, and even it if was, it’s unlikely that everyone in a large city or a large county would drive to your location.
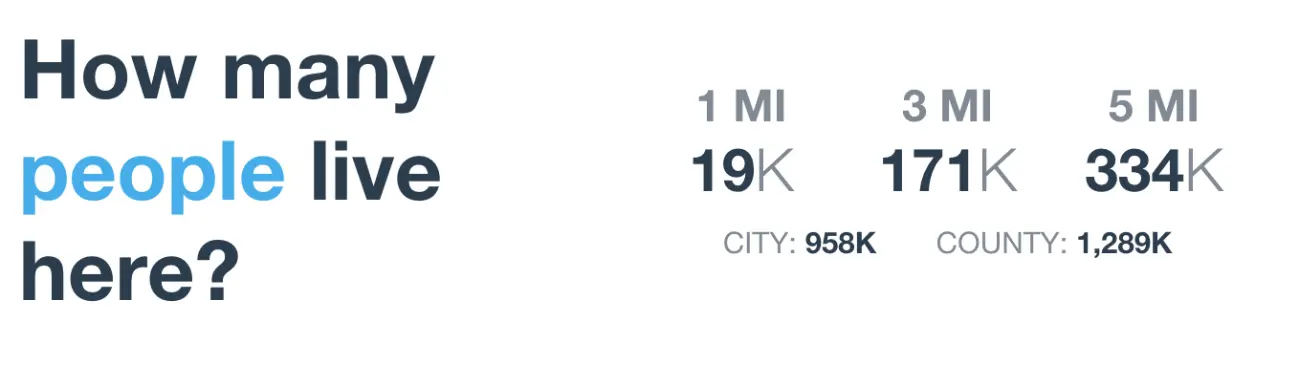
A demographic report for radius rings helps you obtain more localized and relevant data tailored to your specific location. For instance, if you're considering multiple potential sites for your business, a radius report can help you compare the demographics within a 1-mile, 3-mile, or 5-mile radius of each site. This level of customization makes radius reports superior for precise site selection and targeted marketing strategies.

Get Step by Step instructions for how to order a radius report for just $75 and instantly delivered.
Demographic Report 3: Drive Time Reports for Travel Sheds Around a Location
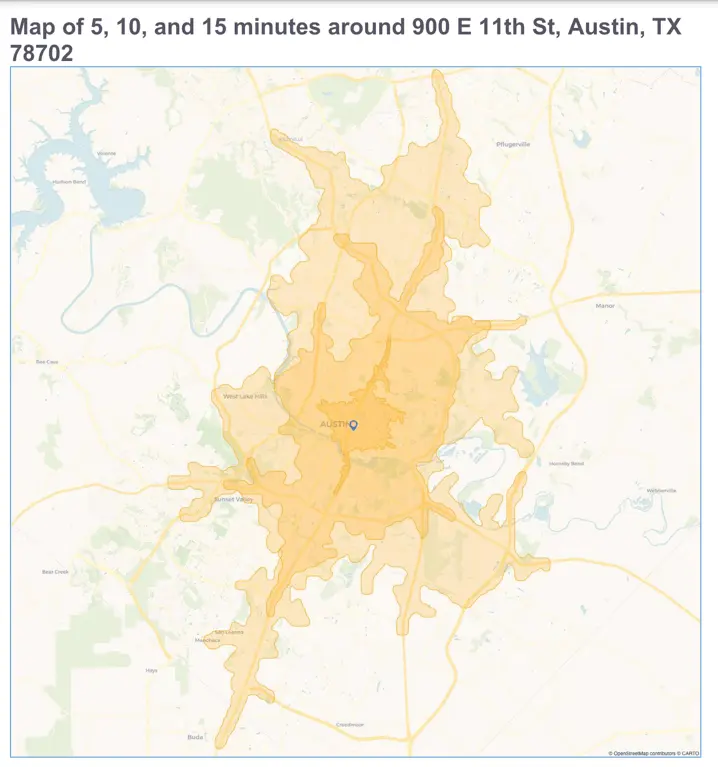
Drive time reports provide demographic data based on the travel time to your business location, rather than a simple geographic radius. These reports consider real-world factors such as road networks, traffic patterns, and physical barriers, offering a more accurate representation of your accessible customer base.
For businesses where convenience and accessibility are critical—like retail stores, restaurants, and service-based businesses—drive time reports are particularly valuable. They help identify the population within specific travel times (e.g., 5, 10, 15 minutes), ensuring that your site is easily reachable for the majority of your target customers. While drive time demographics reports offer a practical, real-world perspective on customer accessibility, making them an excellent choice for optimizing location-based strategies.
Get Step by Step instructions for how to order drive time reports.
What Demographic Data Should You Get in Your Report
Since 2009, we’ve worked with 14,131 businesses to get the most current demographics available in their reports. We’ve noticed that most businesses need at least 5 variables.
-
Population (and/or Population Density)
A demographic report should include data on the population size and density within a specified radius around a location. This variable helps you understand the size of the potential customer base in the area.
Population density specifically helps you identify if your area is urban, suburban or rural. It’s interesting that different businesses perform better in areas of different population densities, but for the most part, more of your target market is better.
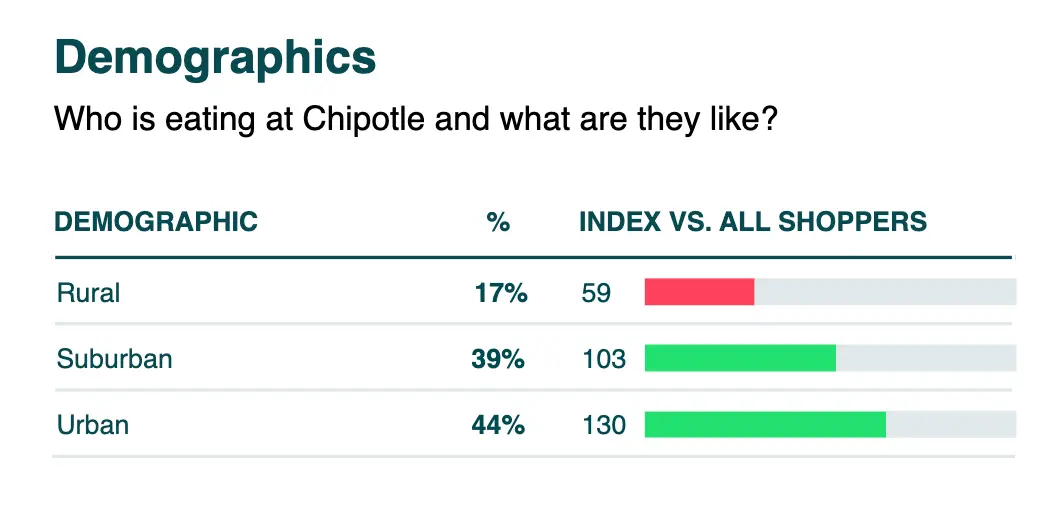 Source: https://www.numerator.com/snapshots/chipotle/
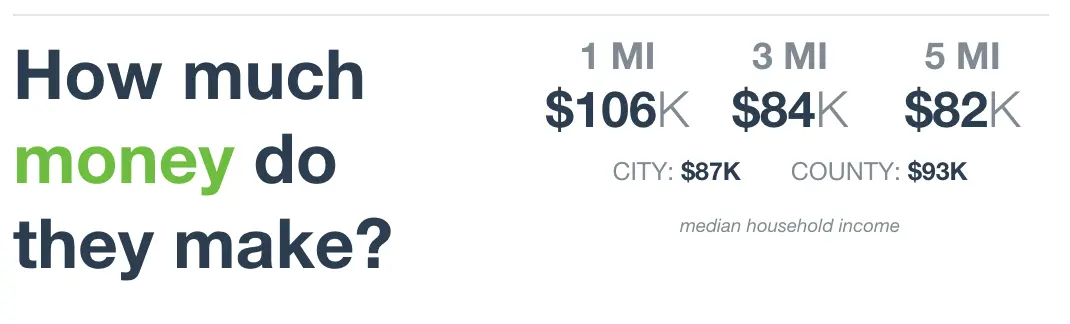
Income
Whether your target market is high-income, low-income or somewhere in middle, you still want to know how much money the people in your area of interest make. Income data can help you price your products and services and narrow your estimates of potential customers.
Population Growth or Projections
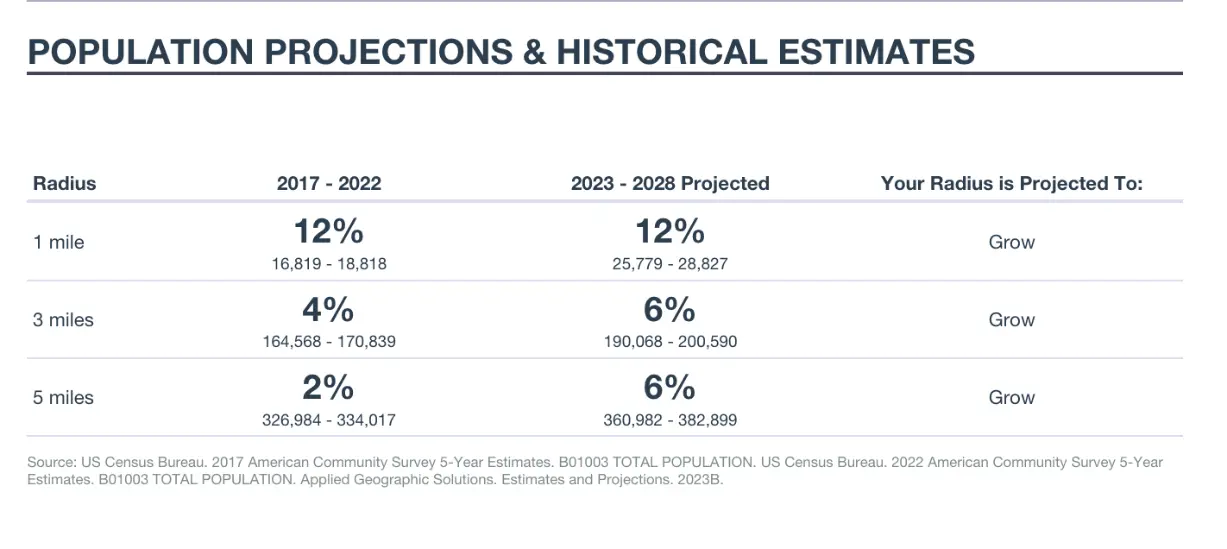
Population growth uses historical data to indicate if an area is growing, shrinking or staying the same. Population projections use historical population growth data to make educated guesses if an area will growing, shrinking or staying the same in the future. Understanding historical growth trends and future projections allows business owners to strategically choose locations and tailor marketing efforts to meet the evolving needs of the ever changing population.
Sex, Age and/or Households Type
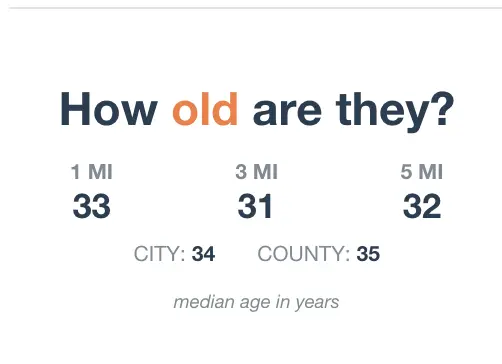
Most businesses consider sex and age when defining their target market, because these demographics significantly influence consumer behavior, preferences, and purchasing power. For example, cannabis businesses tend to focus on the number of male college students whereas a new pickleball facility may be more interested in retired seniors.
Household type is another popular variable. An exclusive daycare may be interested in areas with lots of married couple families with children where both parents work outside the home whereas dating apps like Tender and Bumble would want to target their marketing to places with lots of singles.
Housing Data (Housing Units/Owners vs Renters/Home Values)
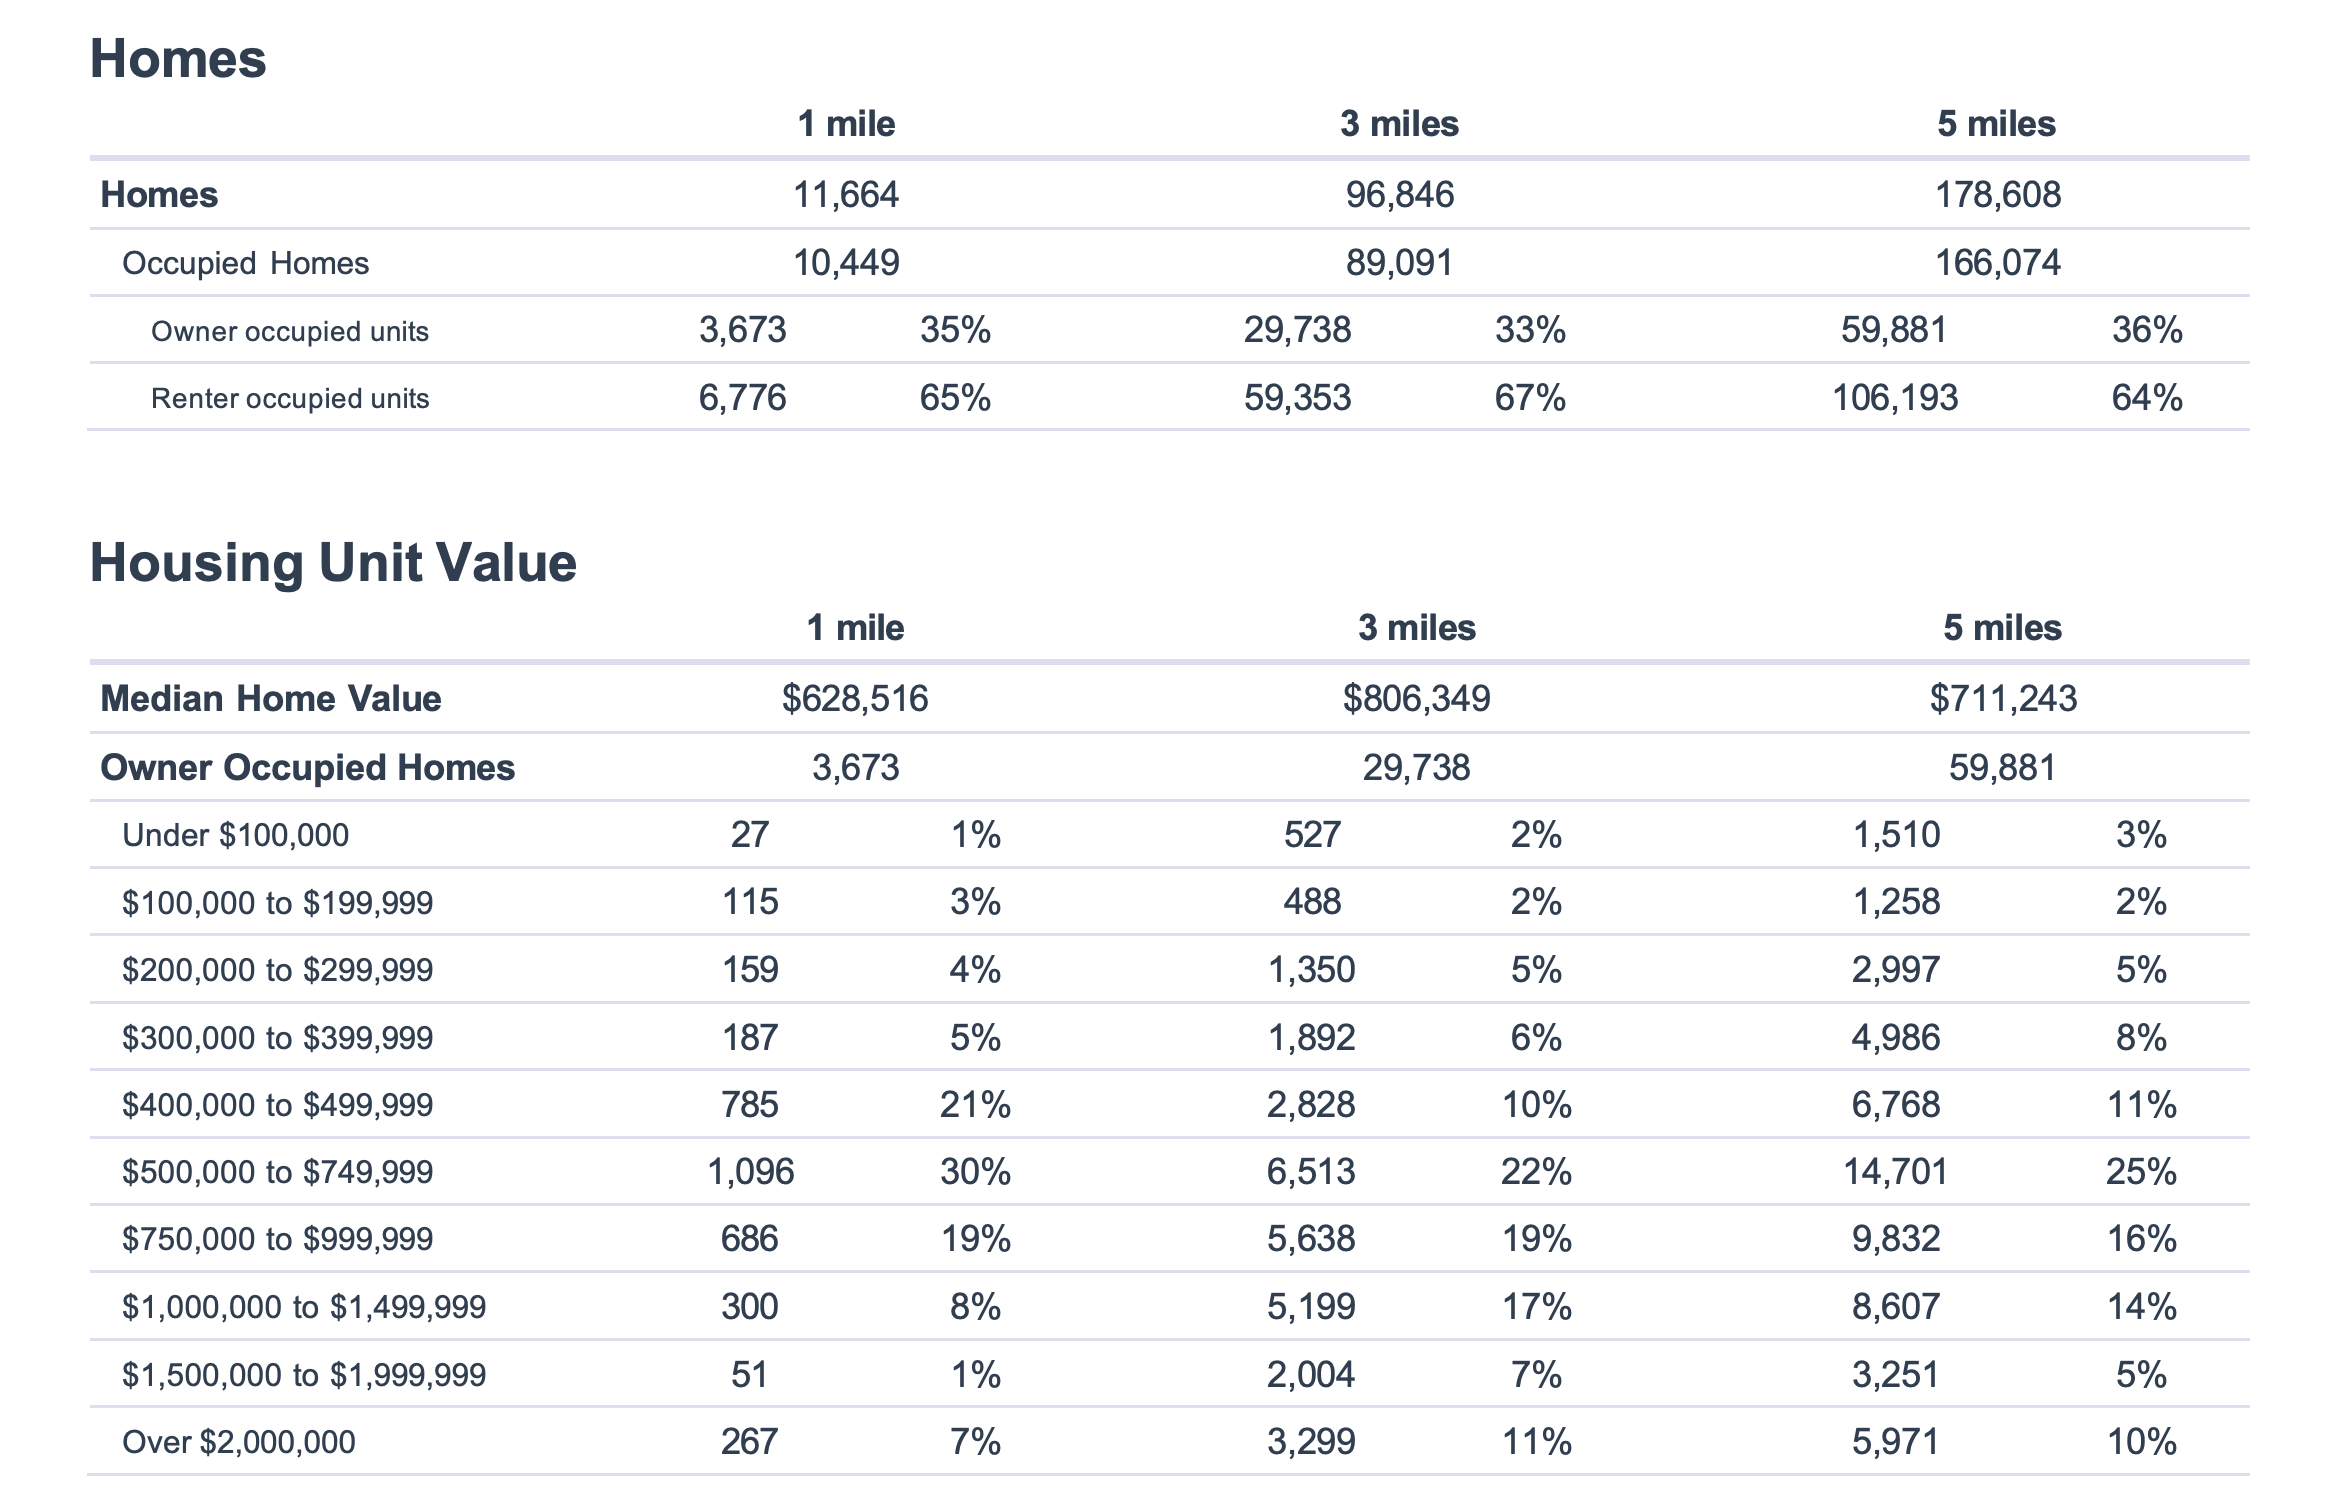
Housing data is another essential variable in a demographics report because it helps businesses understand neighborhood stability, purchasing power, and long-term growth potential. Key housing variables include total housing units, owner versus renter occupied homes, median home value, and home value distribution. These data provide insight into both the size of the residential market and the economic characteristics of the people living there.
Housing data works especially well alongside population, income, growth, and age variables because it helps explain how people live in an area. For example, areas with high homeownership and rising home values may indicate strong demand for family-oriented services, home improvement, and retail businesses, while renter-heavy markets may be better suited for convenience-focused businesses, restaurants, or delivery services.
Median Income versus Average Income: Which Should You Use?
We usually suggest using median income data – either instead of or in addition to – average income data. If you have’t thought about median versus average since your last standardized test, you aren’t alone.
- average is the sum of a set of numbers divided by the count of numbers in the set
- median is the middle number in the set of numbers

Now let’s say you had the following simplified set of income data.
Household 1: $30,000
Household 2: $50,000
Household 3: $1,000,000The average income for this set is $360,000. The outlier data point ($1,000,000) skews the average WAY up. Conversely, the average income would be skewed WAY down if someone had an income of $500. The median income for the same data set is $50,000. Outlier data doesn’t skew the median.
Most Business Owners Should Use Median Income
So most business owners should use the median income as a true indicator of wealth because it provides a more accurate representation of a typical income, especially in areas with significant income disparity.
When Should You Use Average Income
If your target market is high-income households, the average income may be more relevant. This is because the average income can highlight the presence of a higher concentration of wealthy individuals, which is beneficial for luxury goods and services marketing.
How to Use Demographic Reports
Using demographic reports to make informed business decisions involves obtaining reports for each potential location and comparing them to identify the best fit for your target market. This analytical approach helps in making data-driven decisions that reduce risk and increase the likelihood of a prosperous business venture.
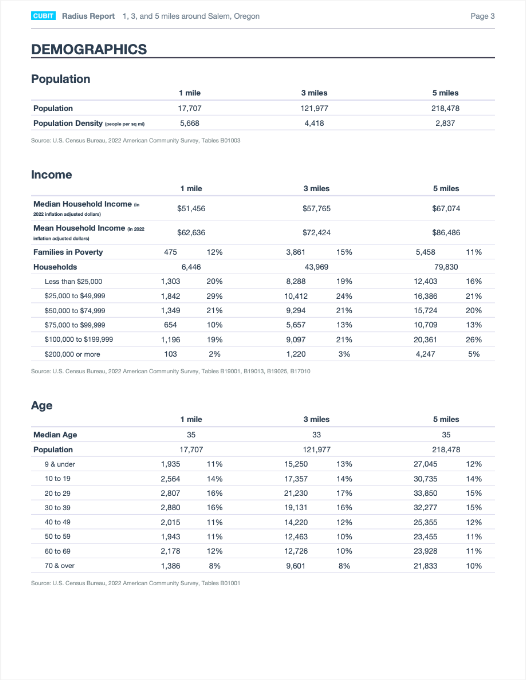
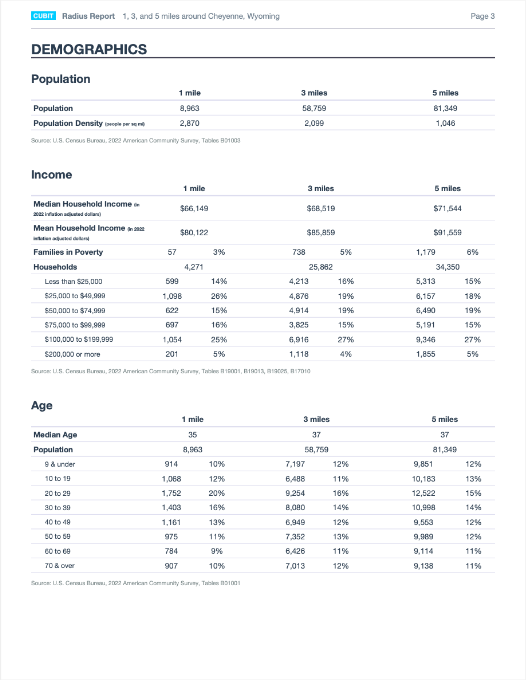
Good demographic reports make it easy for you to compare locations.
That said, demographics aren’t the only factor to consider when deciding where to open your next location. You’ll also want to consider rent and other real estate factors as well as competitors. If the rent is too high, the location is too hidden, or if there are too many well-established competitors, you may consider a different area even if the demographics are just right.
For small business owners focused on site selection and target marketing, demographics reports, particularly radius and drive time reports, are invaluable tools. They provide localized, customizable insights into the characteristics of your potential customer base, helping you make informed decisions and optimize your business strategies. By leveraging these reports, you can enhance your site selection process, create effective marketing campaigns, and ultimately drive your business success.
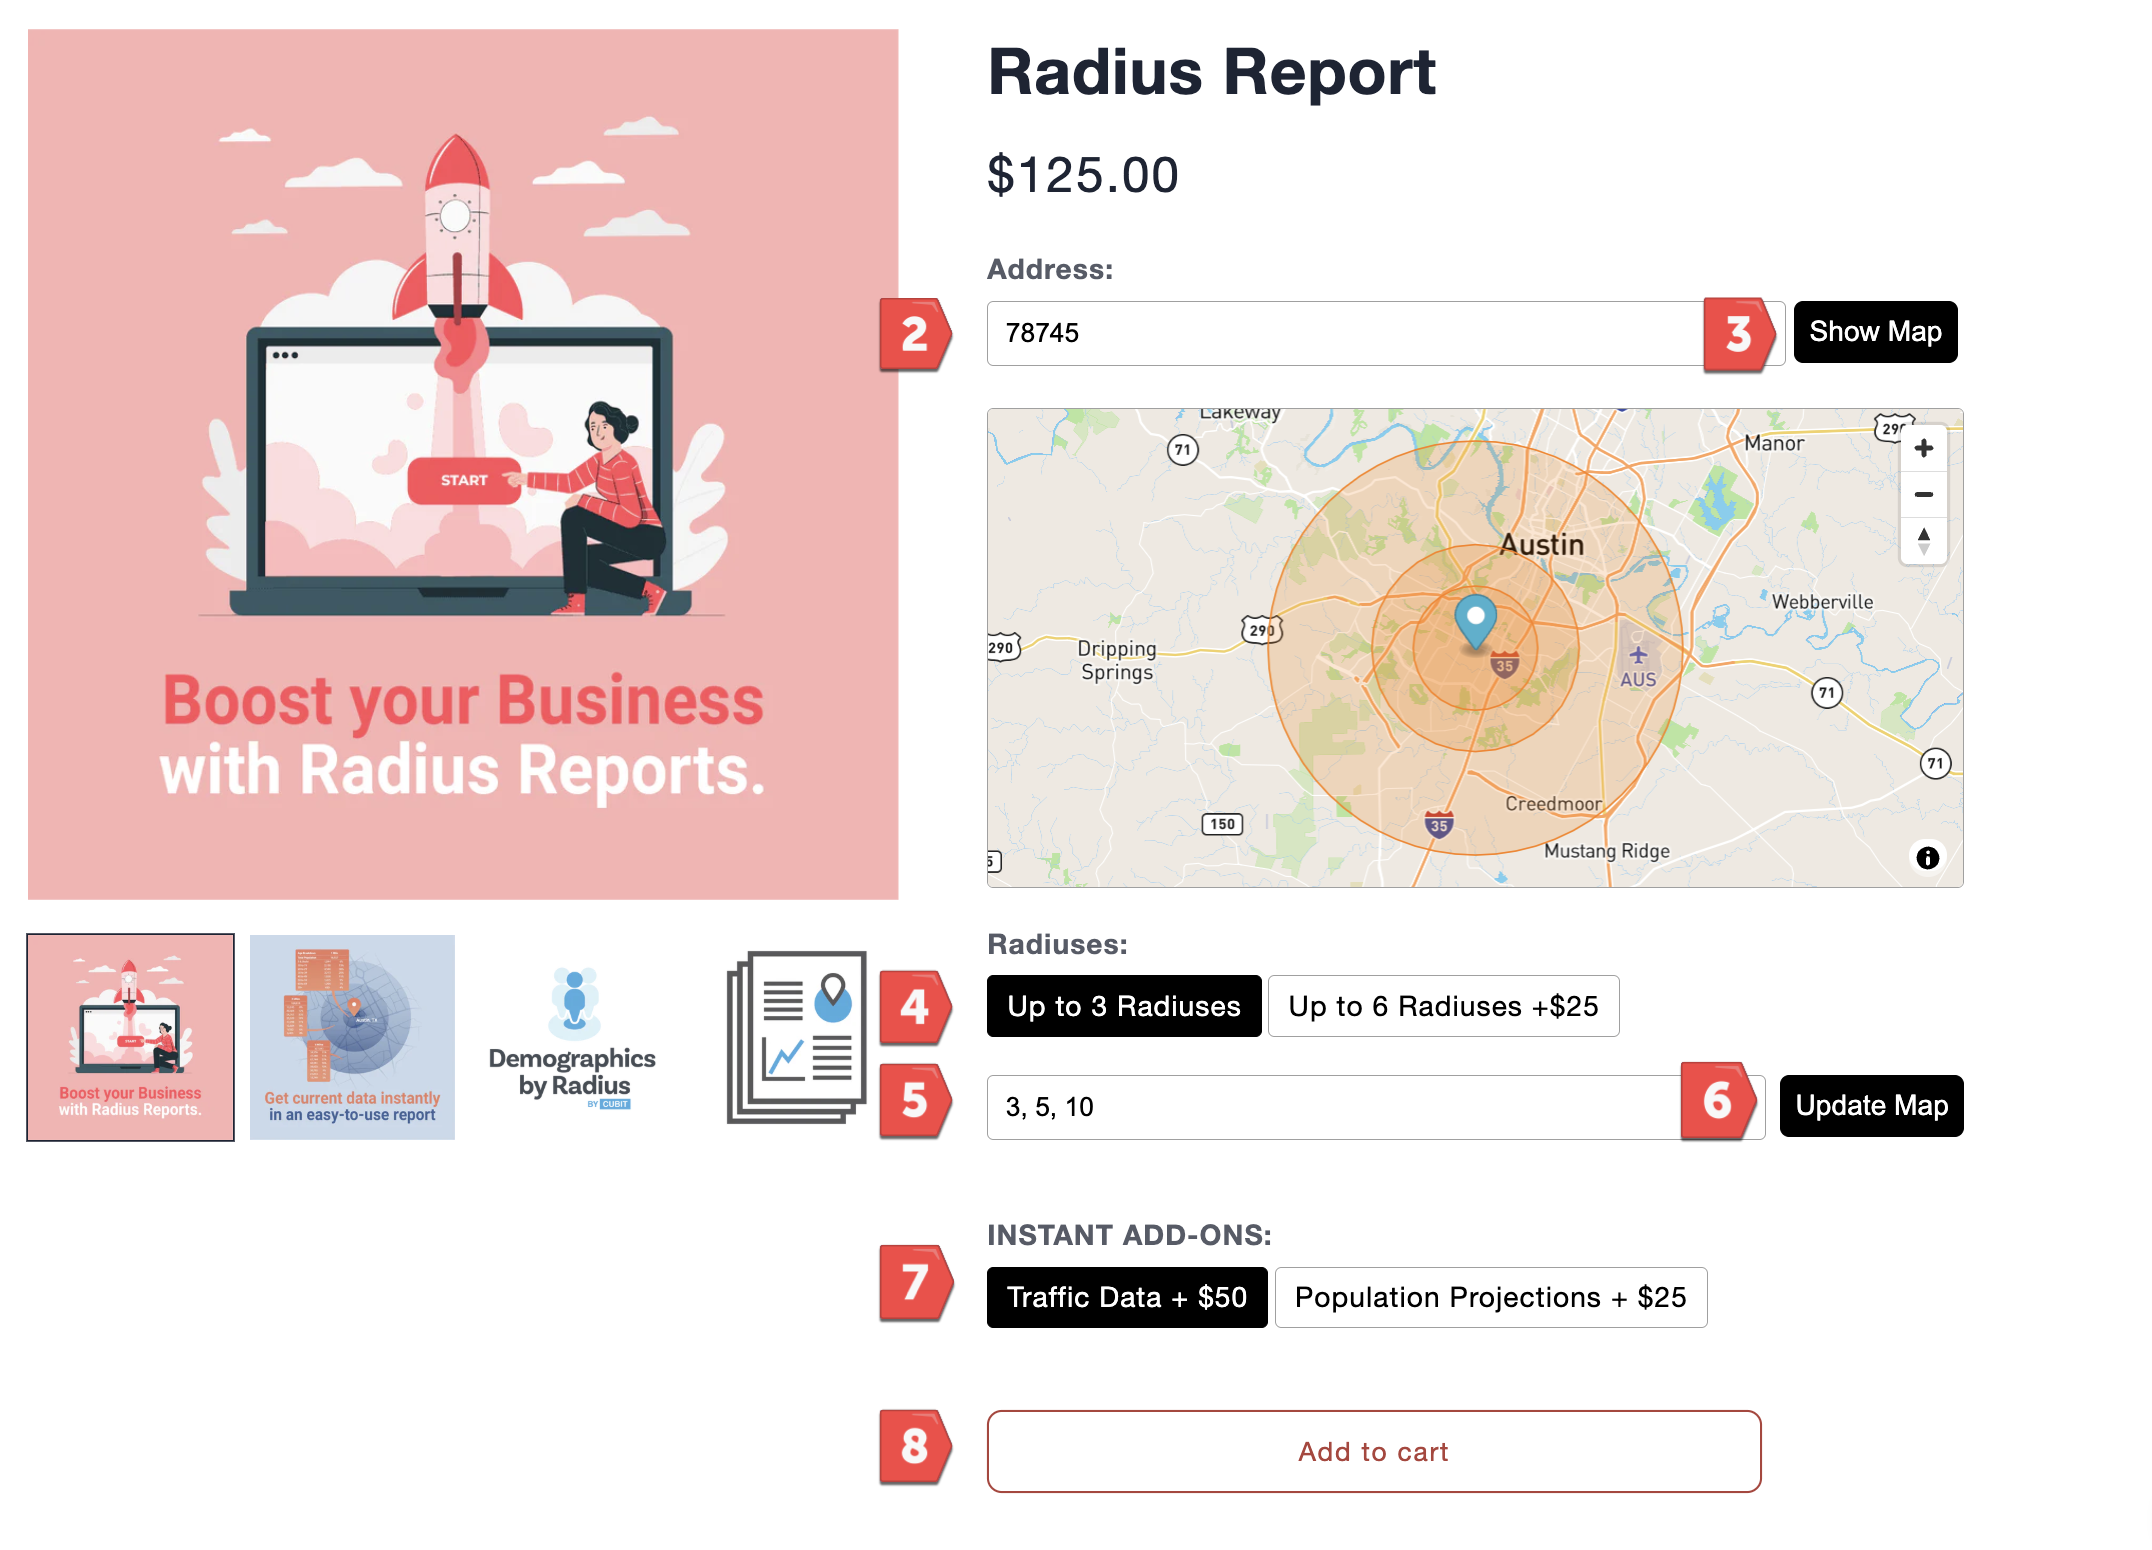
Step By Step Instructions for How to Order a Radius Report
- Go to our Radius Report order page here.
- Enter the address you would like to use as the center point.
- Click “Show Map” to ensure that you have the correct location on the map.
- The report includes up to 3 radius distances. If you want additional distances, click “Up to 6 Radius Distances + $25”.
- Enter up to 3 or up to 6 radius distances, depending on your selection above.
- Click “Update Map” to update the radius distances on the map.
- Choose additional add-ons if interested, such as the “Traffic Data + $50”.
- Click "Add to Cart".
- Go to your cart and complete the checkout.
- Demographics reports, additional distances, Population Projections, and Traffic Counts are delivered as instant downloads.
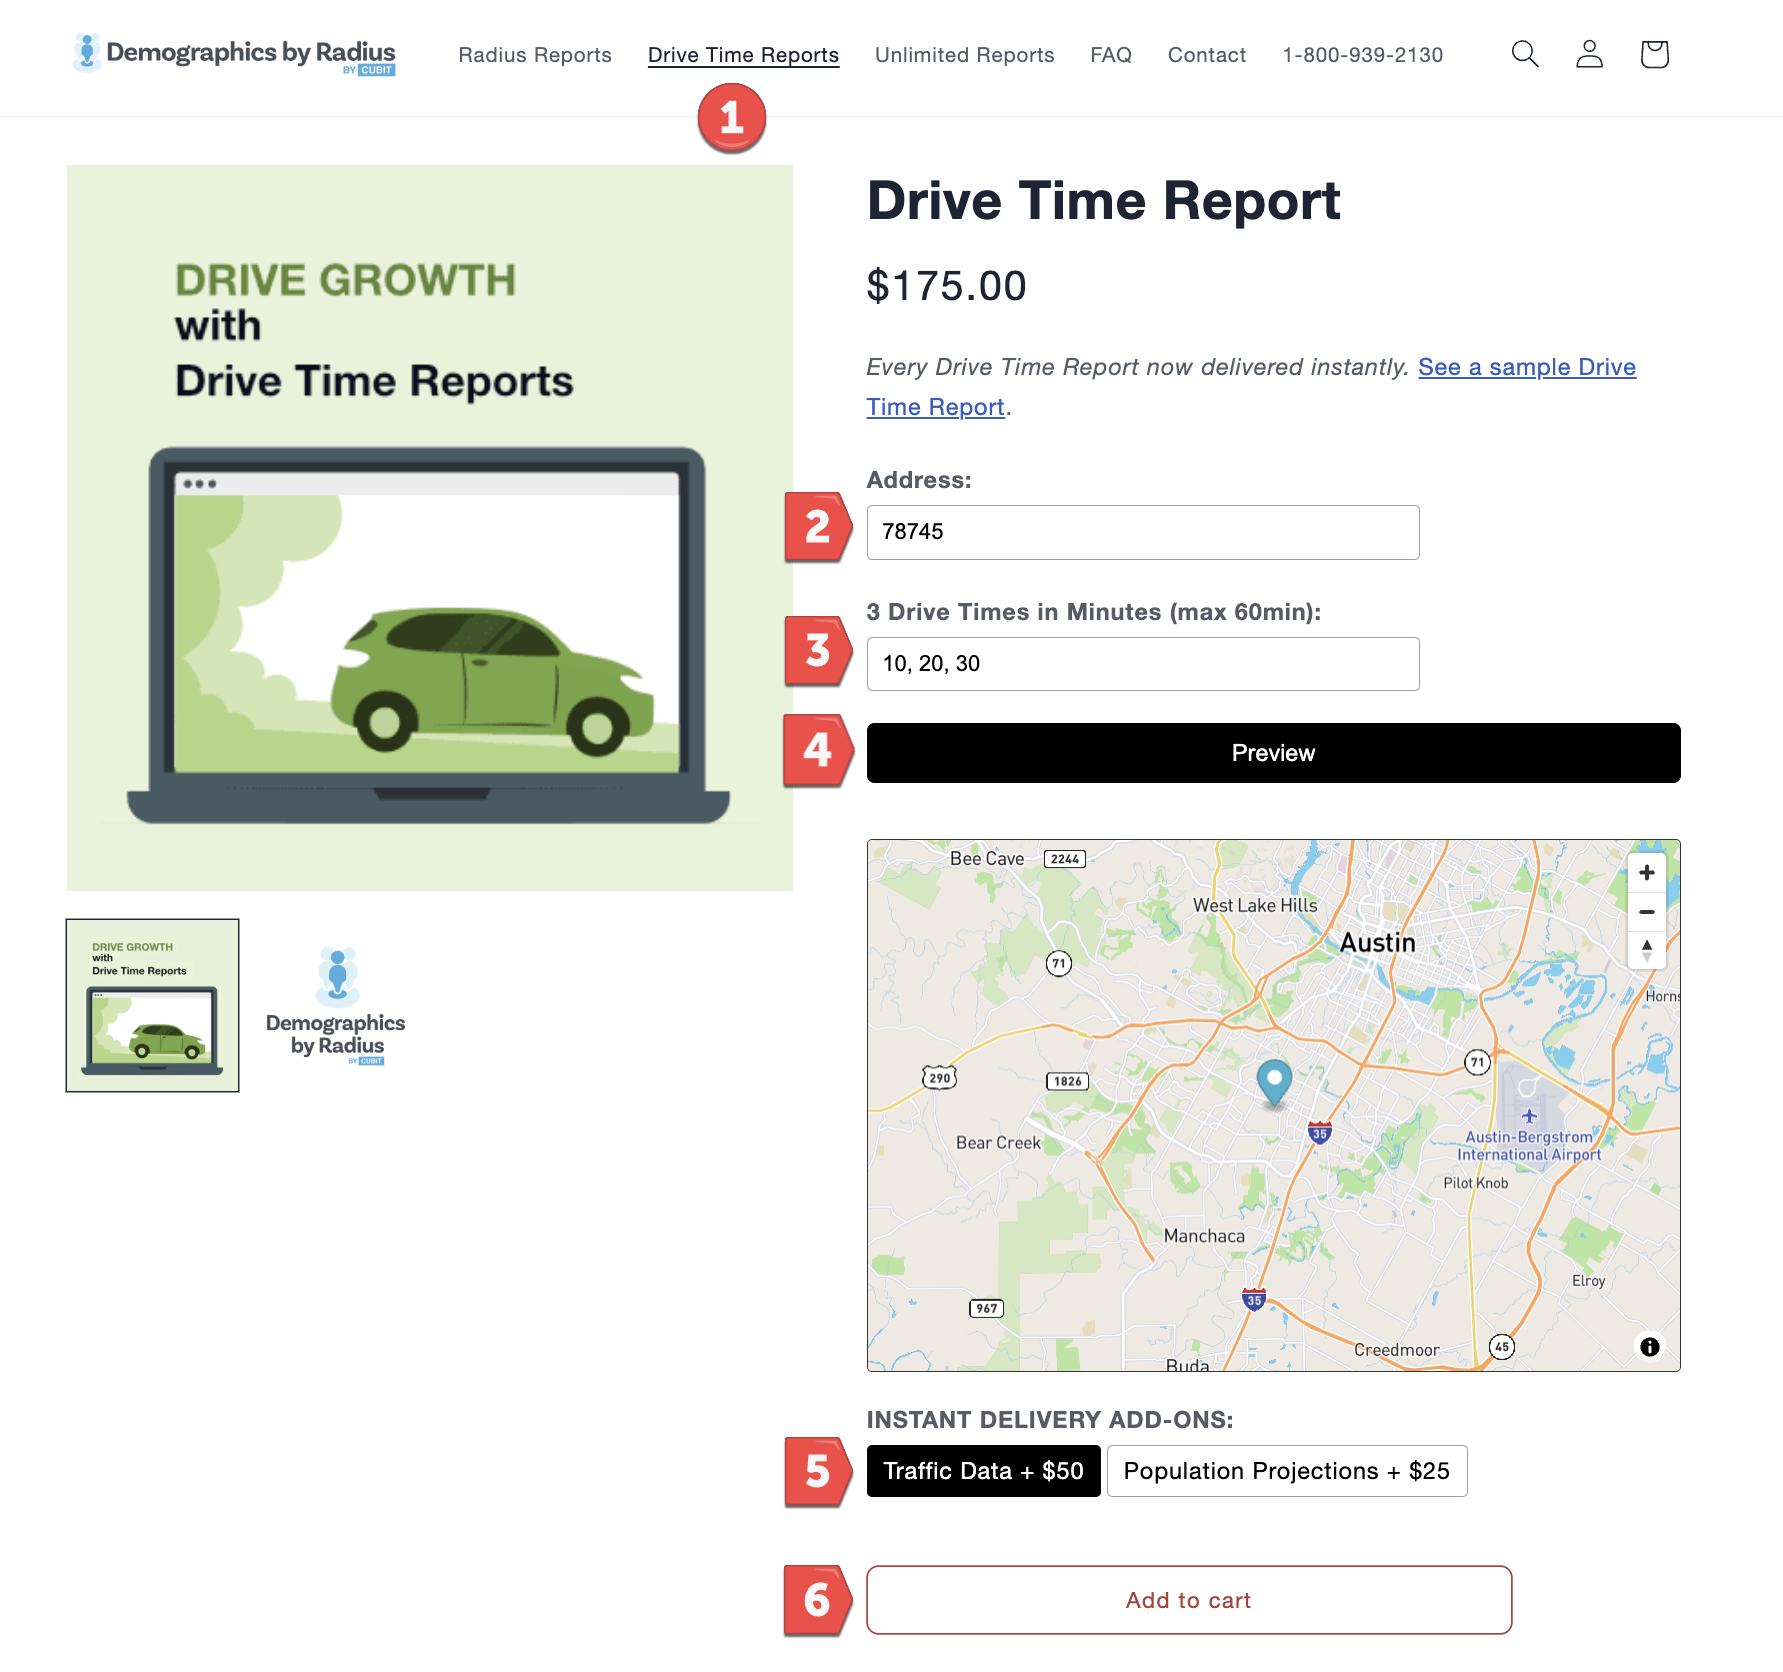
Step By Step Instructions for How to Order a Drive Time Report
- In the order page, click “Drive Time Reports” in the main menu.
- Enter the address you would like to use as the center point.
- Enter up to 3 drive times in minutes. (e.g. 10, 20, 30)
- Click “Preview” to ensure that you have the correct location on the map.
- Choose additional add-ons if interested, such as the “Traffic Data + $50”.
- Click "Add to Cart".
- Go to your cart and complete the checkout.
- Demographics reports, additional distances, Population Projections, and Traffic Counts are delivered as instant downloads.